Jeremy Torgerson, CEO, CIO & Senior Advisor
Our Economic nSight articles are written once weekly by nVest Advisors CEO Jeremy Torgerson for the general education of the public, and as a way to provide transparency for our clients and sponsored-plan participants as to how we create and modify our investment models. It is copyrighted and may not be republished in whole or in part without written permission.
At nVest Advisors, we believe that successful investing depends on an understanding of, and correct response to, changes in the world economy as they happen. We incorporate real-world economic conditions into almost all of our investment models and strategies at nVest Advisors, which we believe provides significant benefit to our clients’ overall investment returns by reducing various short-term market risks and enhancing portfolio performance over time.
For more information about our investment philosophies and management style, click here. To receive these economic updates and other company news via email when they are published, always free of charge, please subscribe here.
Good morning and happy Monday! After a week off to host our company’s CLIENT TOWN HALL MEETING last week (now available as a replay) we’re back with a quick look at the economic data over the past two weeks, and how they are impacting the investing strategies we use for our clients.
Keeping up with global economic data is a monumental task. With a financial planning and investment management firm to run, that is committed to doing our own independent research, we are forever grateful to the many excellent Economic aggregation resources that take the work out of gathering this data for us each day. They don’t give us analysis – that’s our job – but just compiling this information can be a full-time job. We want to give a big shout-out (and a thank you) to MacroMicro, TradingEconomics, and The Daily Shot. Though we use several more, these are three of our favorite places to see a daily aggregation of economic data, and you’ll often see their charts used here. Also, though it’s been spotty so far, I want to blog a daily journal of economic activity as we head into this recession, which will shortly include daily market and trading activity. Sadly this has taken a back seat in recent weeks to massive (and great) changes happening here at nVest Advisors, but we’ll be back in the routine in August. You can find those at my personal finance blog (undergoing a complete rebrand this summer): “Think Like A Rich Guy”):
- At the Top: Let’s discuss inflation
- Housing update
- Jobs update
At the Top:
Let’s discuss inflation
There has been much celebrating over the last few months about the decline in both Producer Prices (the cost to make the product that companies endure) and Consumer Prices (what you pay at the store for the finished, marketed product). And indeed, a reprieve in prices of some basic goods and services is a good thing for our families and small business budgets.
But we remain concerned about inflation coming back, for a number of reasons I wanted to discuss today. I’ll try to keep things simple but lay out our premise that inflation has strong upward momentum.
First, let’s remember that there are multiple layers to inflation data. The two that get the most media attention are HEADLINE and CORE data. Headline inflation is a look at an entire basket of goods and services and comparing today’s price to some point in the past, but headline inflation data includes items that we don’t buy all that often (airplane tickets and a new TV set, for instance). CORE inflation consists of those regularly-occurring parts of our budget like rent, groceries, gasoline, subscription media services, etc.
The HEADLINE inflation number has come down pretty forcefully over the past 9 months or so…
source: tradingeconomics.com
…but the CORE inflation figure remains largely “stuck” at around a 5% year-over-year increase:
source: tradingeconomics.com
There is also the problem of hearing the news report that “Inflation is coming down” without understanding that in no way does that mean prices are dropping. Prices are still increasing, month-over-month and year-over-year for the last four years now (rapidly inflating after the stimulus activity around the Covid-19 shutdowns that began in earnest under President Trump and continued under President Biden). So even though the rate of increase is slowing, prices are still going up:
source: tradingeconomics.com
It is the cumulative effect of inflation, not the current monthly or quarterly change in the rate of increase, that is hurting so many families, and this is what the Federal Reserve is working to slow so that wages can catch back up with the new level of prices. It is highly unlikely (unless we have a significant recession that results in price DEflation), that prices will drop from today’s levels; the Fed just wants to slow it down to below the rate of increase on your wages for a while.
The biggest problem with inflation data is that they are backward-looking. This is important in some regards – we do need to know what has actually occurred. However, looking backward all the time means we may miss the pothole directly in front of us. We believe there are indeed ways to show where inflation may be headed in the months ahead, and those are the factors we use when it’s time to make investment decisions for our clients.
Here are some of the ways we assess future inflationary pressure:
- Oil prices. Energy costs affect the prices of nearly everything else in the economy. Every product needs to be manufactured, shipped to a store, placed on a shelf in a lighted and climate-controlled store for you to buy, or must be delivered to your doorstep. Every step in the supply chain depends on energy, so where energy prices go, the prices of everything else follow.
- Commodities prices. Inflation numbers look at the prices of things that have come and gone; things already consumed. But commodities are traded on the open market months in advance by an instrument called a futures contract. For example, a coffee manufacturer will want to secure enough coffee beans to meet their production demands for the coming six months, so they may purchase contracts to buy coffee beans at pre-determined prices during that period. That makes sure they have enough product, and that the price of that product is correctly and accurately budgeted for.
- Personal savings rates. This is how much of our take-home pay is actually still hanging around after our bills are paid each month and are put in savings. Although personal savings rates are not entirely connected to consumer prices (some of the savings rate has to do with tax refunds, wage increases, and interest rates on personal debt), the fluctuation in personal savings rate definitely gives us an idea of how family budgets are being squeezed (or relaxed) based on the costs of living.
- The strength of the dollar relative to other currencies. This makes sense when you think about it. If the dollar is relatively “strong”, it will exchange for more of other currencies when we are importing and exporting products and services abroad. A strong dollar means it will buy more “stuff”, and a weak dollar means it will buy less. During periods of a strong dollar, it would make sense to see inflationary pressure ease up, but during periods of a weak dollar, it would mean
There are other factors, as well, but these four will give our clients a good idea of how we determine where inflation may be headed (instead of looking only at where inflation has been).
So while the market has been celebrating the recent decline in inflation (mostly HEADLINE inflation), does that mean the trajectory on inflation is a sure thing? Let’s look at each of the four leading indicators and assess:
- Energy Prices. Energy prices did decline since the summer of 2022, largely due to a slowing economy and the use of strategic petroleum reserves to cheapen gasoline for consumers by about 20 cents a gallon. That trend has reversed in the past couple of months, as OPEC nations (upon which we are heavily dependent) announced production cuts of millions of barrels of oil per day as these nations anticipate a global economic slowdown. Energy prices have climbed significantly in the last month alone, with Crude oil rising 7.29%:
2. Basic commodities, particularly in several food items, have also spiked. Some of this is weather-related, but there are global shortages in a number of staples, which will rise prices again. Only sugar, corn, and corn-derived ethanol are down over the last 30 days. All other agricultural commodities are up, some significantly:
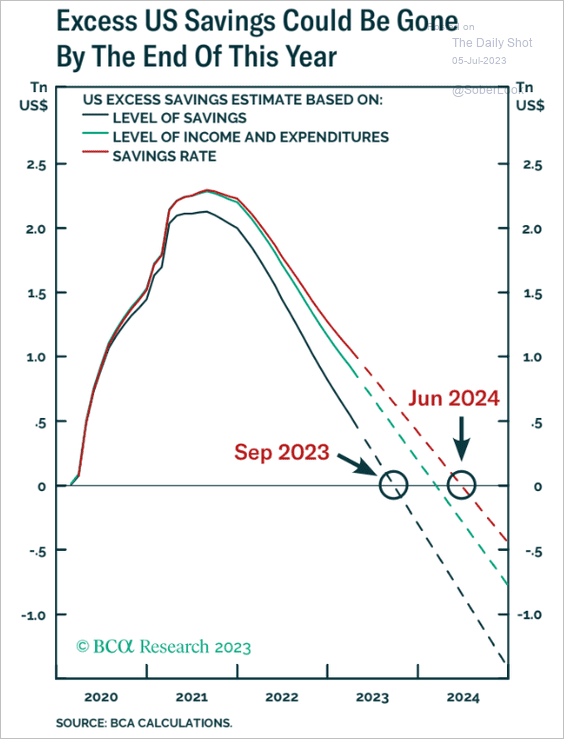
3. The personal savings rate soared during the stimulus-fueled feeding frenzy of Covid-19, and has been dropping since inflation began in earnest in 2021. Despite the recent drop in inflation rates, personal savings continue to decline. Projections are that consumers will be out of the excess savings from Covid by as early as next month. At best, the estimates are that the excess savings will be gone by June of next year (11 months from now).
4. The dollar rose to historic strength against most of the world’s major currencies in the fall of 2022. This coincided with the drop in the inflation rate (which matched our theory). Since then, the dollar has been dropping in relative strength and appears to have reached a bottom earlier this month. It has been falling alongside HEADLINE inflation, but remember, CORE inflation remained very sticky, only falling slightly over the last six months. We believe the strength of the dollar is more strongly correlated to CORE inflation than headline inflation.

If the dollar rallies to higher places again in the coming months, we believe this will put further downward pressure on core inflation, but at current levels, the dollar is weak enough that it is no longer helping to cool prices off. If the Federal Reserve bank eases off of its Quantitative Tightening (QT) activities too quickly in response to changes in the headline CPI, it can cause the dollar to weaken further, which would send prices back up again.
There is precedent for this. The last time we dealt with sustained inflationary pressure was in the 1970s, in which inflation came in three successively higher waves until 1981, when then Fed Chairman Paul Volcker implemented what is now known as the Volcker Shock, and raised interest rates to over 18% at one point. It was only then that inflation was finally beaten after more than 10 years of false hope. We run that risk again if we do not allow the Federal Reserve to finish the job on inflation.

What this means to you
We remain hopeful that inflationary pressure continues to ease, but recent changes in energy and commodities prices give us concern that inflation is starting to strengthen again. This is exacerbated by the recent stock market rally, which we’ve always maintained was not based on actual economic strength and was instead speculative and bias-driven (and would eventually come back down). We remain steadfast that the worst of this economic cycle is directly ahead of us, and our clients are invested with that conviction firmly in mind.
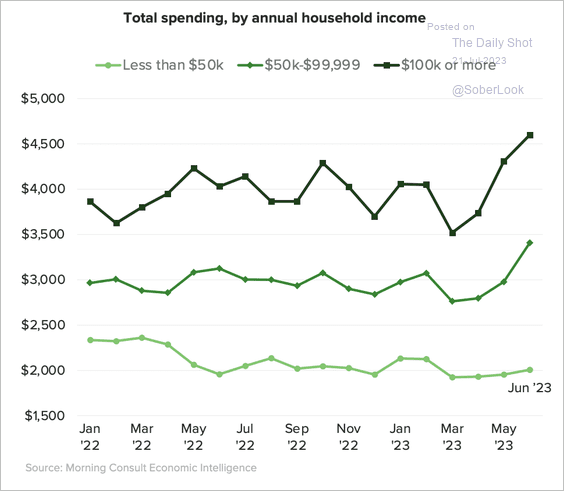
We strongly believe we are correct that the markets are missing the actual impact of rising prices on consumers, as they interpret increased consumer spending recently to be a good sign for the economy. This is nonsense. It is true that consumers are spending more each month than just a few months ago, but we maintain that this is the result of price increases, not more confidence about the coming year in the economy:
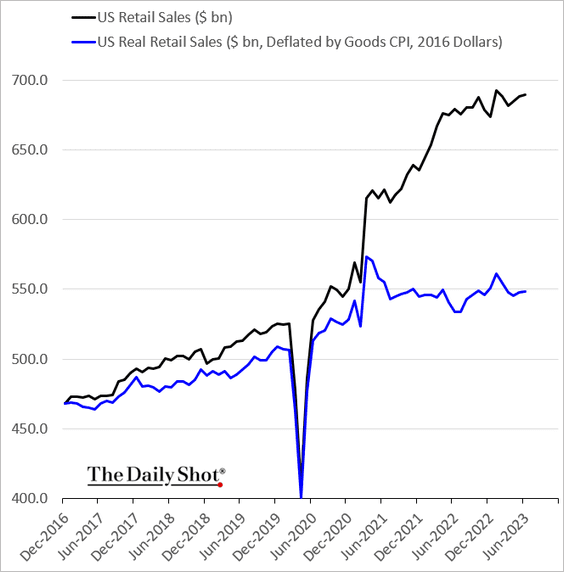
And we can clearly show that consumers ARE spending more; they’re just getting less because inflation has driven prices up significantly. This chart shows spending in dollars (the black line), but the actual amount of product that those dollars are buying now (the blue line). Consumers are buying LESS than they were a year or two ago. They’re just having to pay much more for it. This shows us that the slowdown in the economy is just getting underway, made much worse by the return of student loan payments in October that were furloughed since 2020.
Plus, an alarming amount of this spending has shifted from actual cash sources to credit cards:

Housing Update
We often discuss actual activity in housing (homes sold, mortgage loan rates locked, etc.) but permits and new starts tell us where the sector is headed. Today’s update on housing looks at what is coming up. Remember that some housing is seasonal – more people move in the summer and far fewer around the winter holidays, so comparing year-t0-year for the same week’s activity really helps us to see what is happening.
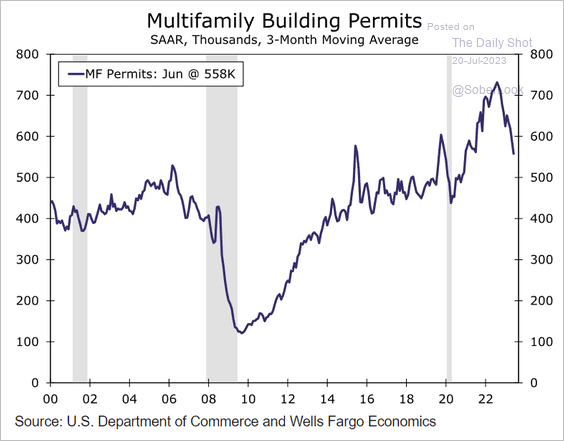
First, building permits for multifamily units (apartments, condos/townhomes, duplexes, etc.) is coming down pretty sharply but remain above historical averages.
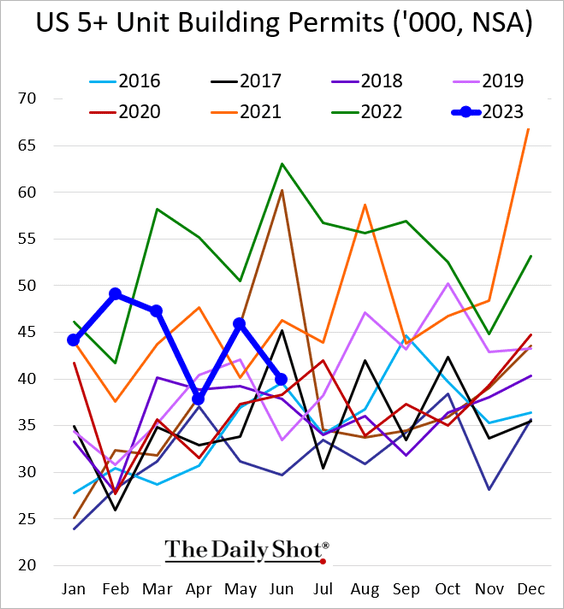
Larger unit permits dropped last month and the year-long trend of lower highs and lower lows defies the trend over the last 8 years.
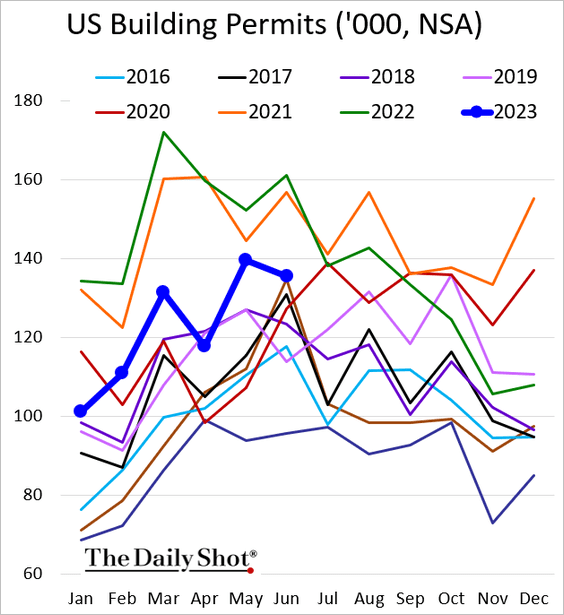
Overall building permits are following seasonal trends after a pretty strong start to 2023. Remember that a permit is not a finished building.

What’s kept home prices up as much as they have so far is simply that no one is putting homes up for sale. Current existing home inventory is the lowest – by far – in the last 8 years.

This is despite the fact that the housing affordability index is the worst in history. A mortgage bought today will take more than 40% of a family’s monthly budget. This makes most homes unaffordable to buyers (they won’t qualify for a mortgage loan), so the tentative equilibrium of no eligible buyers and no inventory is all that is holding up the real estate market prices for now. If a recession causes a sudden surge in homes for sale, house prices will drop substantially.

Existing home sales are the slowest in the last decade:

What this means for you
Housing permitting and starts remain fairly strong but as mortgage rates remain elevated, we expect that to cool off significantly in the coming months. We are particularly concerned with Commercial Real Estate, which could face a serious correction. We remain optimistic for our clients who are looking to buy an affordable home that they will have the opportunity in the next 12 to 24 months.
Jobs Updates
We’ve been predicting the jobs market to surprise analysts negatively for the last few weeks, and it appears this is starting to show up now in the data. First, the huge spike in wage growth we saw after Covid has moderated. This means employers are able to find workers easier than they did a year ago, and have to offer less pay and benefits to fill their open positions.

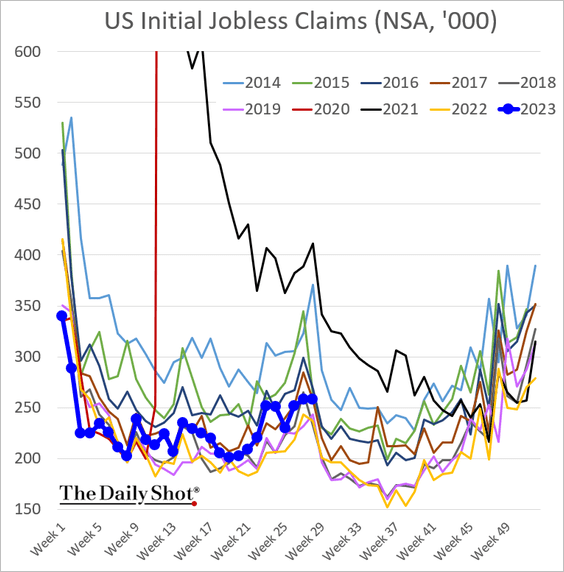
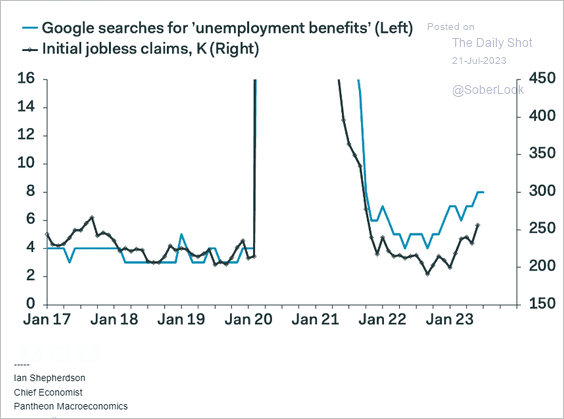
The initial jobless claims came in a little higher than the previous weeks but did not spike seasonally, as is typical during the month of July. What will be interesting, and a tell-tale sign for us of coming jobs concerns, is if the 2023 line remains flat and crosses above most of the last decade’s seasonal trend of lower jobless claims for the next three months. We expect to see jobless numbers take off from here.
This is anecdotal, but we are seeing a surge in Google searches for “unemployment benefits”. Normally the Google search for this term is almost completely correlated with the actual claims for unemployment (see January 17-Covid in 2020). Since last year, however, the number of searches is above the actual filings, but we believe this is a leading indicator of coming jobless claims.
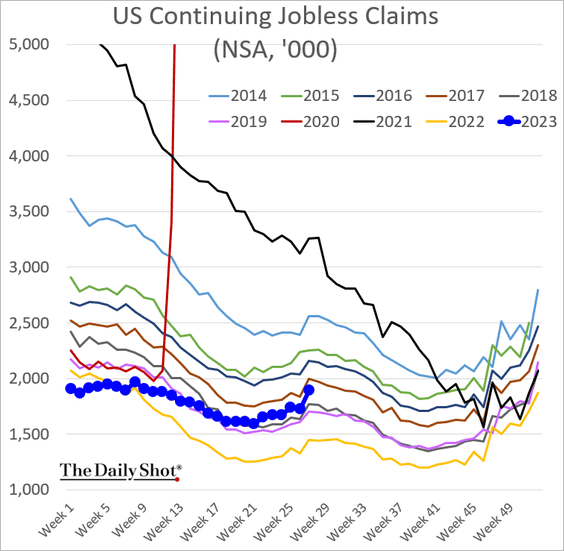
It is the CONTINUING claims that are much more important to our economic analysis than the initial claims. Initial claims mean someone has lost their job and no longer has a severance pay package, but those typically drop off quickly as people find new work. If the CONTINUING claims increase, it means there are no new jobs out there.
We have watched the continuing claims remain low but persistent all year (no longer following seasonal trends). The spike last week in continuing claims was unexpected for most analysts but we’ve been predicting it for the past several weeks. If this trend continues, we can be near certain that a recession is imminent.
And here is a strong indicator that we are correct. This chart compares the number of job openings as reported by the NFIB (small business advocacy group) compared with the duration of unemployment benefits. It’s perfectly logical that the fewer jobs are out there, the longer someone will remain unemployed. The red line (which is inverted) shows the number of job postings by small businesses (where 80% of the jobs in the U.S. are located); the higher the red line, the FEWER jobs are out there. The blue line, which lags behind the red line by several weeks, is the current number of continuing unemployment claims. Typically they are very closely correlated, so it appears there will be a significant rise in continuing unemployment claims in the coming weeks. (The shaded gray areas are where recessions occurred – we are WELL into recessionary territory for available jobs already).

What this means to you
The job market is about to get much worse as we head into a recession. We urge our clients to reduce their debt load and increase their personal savings, and keep investments conservatively positioned for now. A recession doesn’t mean the end of the world, but it does mean seeing our unemployment rate climb from its current 3.5% to maybe 5.5% or 6.5%. That means, sadly, a lot of lost jobs and financial hardship for many families, so please take the risk of job insecurity seriously.
Bottom Line:

Download our brand-new E-Book “7 Hacks To Recession-Proof Your Financial Life” today.
We remain convinced that a recession is imminent, even as the market fights back hard against it. Do not let the current market rally fool you – there is no sustainable way to grow profits (and therefore a supportable stock price) in an economy that is rapidly losing steam. Corporate profit reports are backward-looking and economic projections are forward-looking. Do not be lulled into complacency just because the stock market allows itself to.
We’ve been alerting our clients for nearly two years now that inflation was going to cause significant problems and our central banks would have to take progressively stronger actions to combat it. That appears to be a correct call.
No one knows exactly when a recession will be declared, but we firmly believe most of the larger economies of the world are right at the door of one now. Recessions can take years to recover from, which is why we believe it is vitally important to get your family and business finances ready to weather through such a storm.
We predicted the beginning of a turn in the current market rally last week, and we reiterate that sentiment now. There will always be market movement that runs counter to the economic data because markets are much more short-term focused, and let’s face it: until fear takes hold, greed is the prevailing emotional state of most market participants. We do believe, however, that the recent rally has fully run its course, and there will soon be a strong shift from stocks into safer investment options such as corporate and government bonds. With interest rates this high, getting a 5% or better yield, risk-free is becoming a more and more attractive option for investors concerned about the coming economic uncertainty. Once there is consensus that either the economy is earnestly deteriorating, or the Fed announces the end of rate hikes, the move from stocks to bonds will accelerate.
Whether you are our client or not, you need to consider the broader economy (and much less so the daily market fluctuations) when making investment decisions. The economy is telling us clearly what is coming, and you need to have your investment accounts prepared before that happens.
Just this past month, I published an ebook to help you get your finances ready for the recession directly ahead. It’s yours totally free. Just click on the book image to access and download it.
Use these economic reports, and those of others working in this space, to prepare. You can not only avoid much of the pain that is coming, but you might actually profit from it, if your investments are properly positioned, and you’ve done what you can to shore up your business’ and family’s financial situation. If you need help with this, nVest Advisors has amazingly affordable personal financial planning and fiduciary investment management services to help you.
This is what we do for a living, and we’re very happy to partner with you on that endeavor.
Reach out to us for a totally free financial and portfolio checkup today if you’re concerned about where your finances sit for the coming few years, particularly if you are at or approaching retirement age. We’re delighted to offer you our thoughts. You can schedule that time with us below:
Watching This Week:
- Jobs Report
- Service Sector Update
- Commodities