Good morning and happy Monday! We had a busy week of economic information last week, so there is a lot to discuss.
We also want to let you know of some changes in this blog’s format starting in October. As the economy worsens, it is important for investors to look not only at economic data (most of which lag behind by 1 to 3 months because they are summaries and estimates of what has already happened), but how the markets are responding to that data. This is a second component to how we create and modify the investment models we use for our client portfolios.
The first new bit of data we are adding to the information mix is called the Buffet Indicator. Created by famed investor and CEO of Berkshire Hathaway, Warren Buffet, the Buffet Indicator compares stock prices directly to the economic output of the United States, to determine if stock prices are within a reasonable range based on the actual productivity of the economy, or if they are under- or over-priced in comparison. The indicator, which has a very good but not perfect track record of predicting market tops and bottoms, tells us when stocks are overbought or underbought relative to the productive capacity of the economy at that time. We will post the most recent Buffet Indicator each week with our economic report, but you can always track this yourself at currentmarketvaluation.com.
This week the Buffet Indicator continues to show that stocks are OVERBOUGHT (too high to justify based on economic conditions):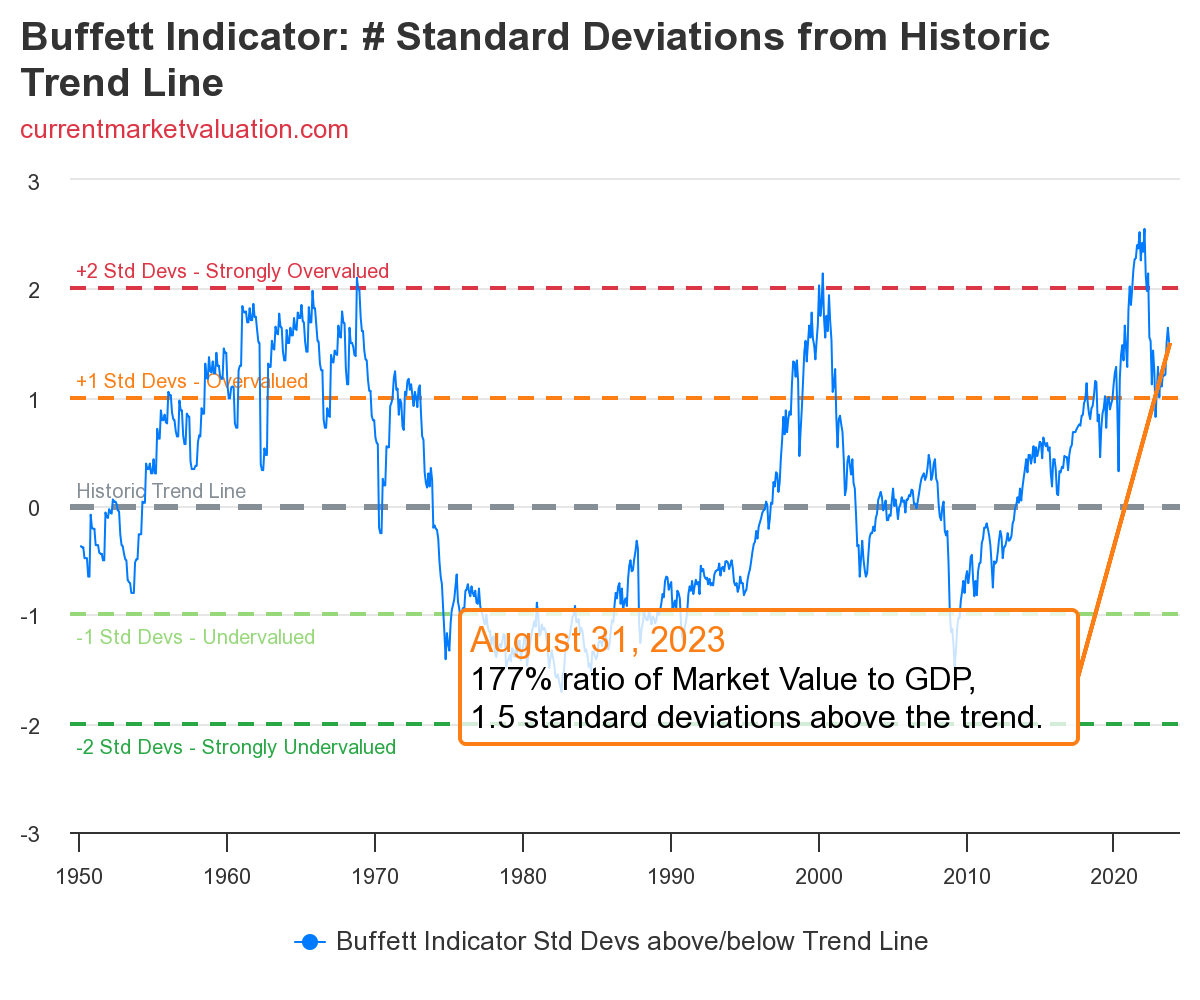
Now, let’s get on with economic indicators for last week:
Keeping up with global economic data is a monumental task. With a financial planning and investment management firm to run, that is committed to doing our own independent research, we are forever grateful to the many excellent Economic aggregation resources that take the work out of gathering this data for us each day. They don’t give us analysis – that’s our job – but just compiling this information can be a full-time job. We want to give a big shout-out (and a thank you) to CurrentMarketValuations, FRED, MacroMicro, TradingEconomics, and The Daily Shot. Though we use several more, these are three of our favorite places to see a daily aggregation of economic data, and you’ll often see their charts used here.
- nFocus: CPI and PPI came in high
- Housing Update
- Jobs update
- Small Business Update
- Manufacturing Update
- Consumer Update
nFocus: CPI and PPI came in high
Last week we received the always highly anticipated CPI (consumer price index) and PPI (producer price index) data for August. As expected, both showed an uptick in prices as inflation began to climb again, bolstered by high energy prices and $1.5 Trillion in new government deficit spending since June. When an inflationary cycle gets underway, inflation tends to run in successively bigger waves over time until monetary policy changes by the central bank are sufficiently restrictive.
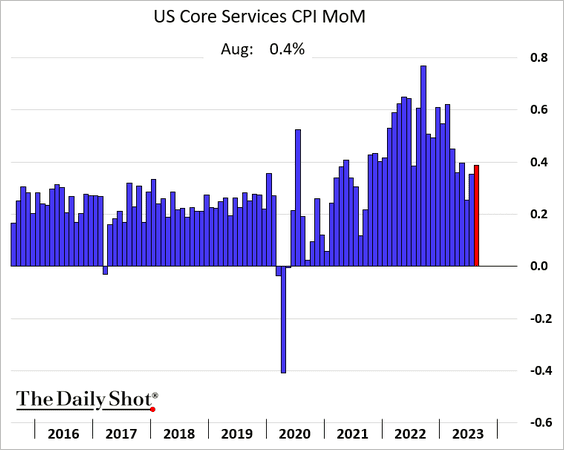
Let’s look first at CPI. Remember that there are many ways to parse the CPI data, but the two most common measures are the HEADLINE and the CORE numbers. Headline inflation is what you see commonly reported (hence, “headline”). It includes pretty much everything you might have spent money on last month. Core inflation is those regularly-recurring household expenses like gasoline, rent, energy bills, groceries, etc. The Federal Reserve is more concerned with Core inflation than it is Headline inflation.
Headline CPI heated up more than expected last month with higher energy prices making up the bulk of the cost increase for consumers (we’ll see this again in the data about consumers):


Core inflation, as opposed to headline, also came in hotter than expected for the third month in a row, definitely reversing the previous trend downward from earlier in the year:

Here you can see the composition of the SUPERCORE CPI (an even tighter look at regularly occurring household expenses but with housing removed. Transportation services were the biggest contributor:

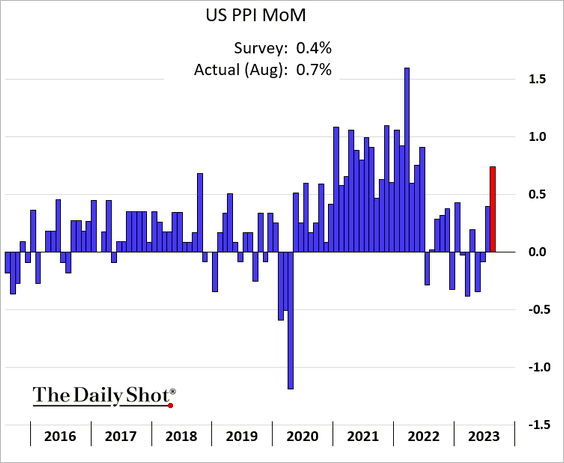
Now let’s turn our attention to the PPI (producer price index). This is a very important “sister” data set for CPI because the prices that producers (businesses) pay to make the goods and services they provide to us, will affect both the prices they later charge for their finished products, and also gives us a hint as to their profit margins.
PPI came in higher than expected, as well, indicating that consumer prices will be rising in the coming weeks and months:
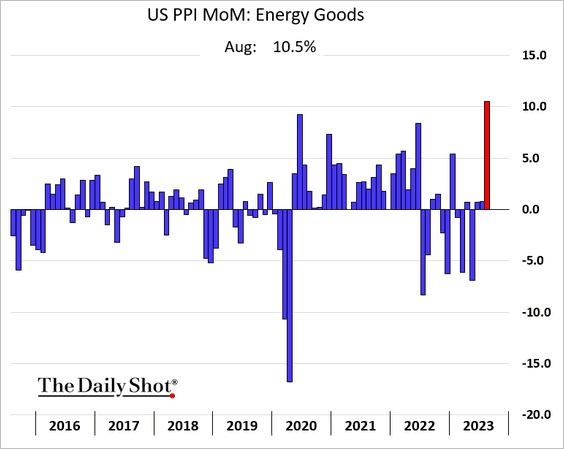
This was due in large part to a huge spike in energy costs:
Just as there is a Core CPI, there is also a Core PPI, which again is the basket of the most regularly occurring expenses for a business. That also rose slightly Month Over Month in August:

What this means for you
Despite a lot of media hype and political spin, inflation is not finished yet. We’ve been warning our clients in this space for many weeks now, that we felt that energy prices had a lot of room to climb again, and the price of energy tends to drag everything else up with it. We say here at nVest: “Where energy goes, everything else follows”.
The biggest takeaway from rising prices is that the work of the Federal Reserve to tighten the money supply sufficiently enough to tamp down demand, is not yet finished. We expect at least one more interest rate hike from the Fed before they pause and allow the full effect of 18 months of rate hikes to impact the economy. However, if inflation continues to ramp upward, you must be prepared for even more significant action by the Fed that can only end in a harsher and longer recession than we are currently slated for.
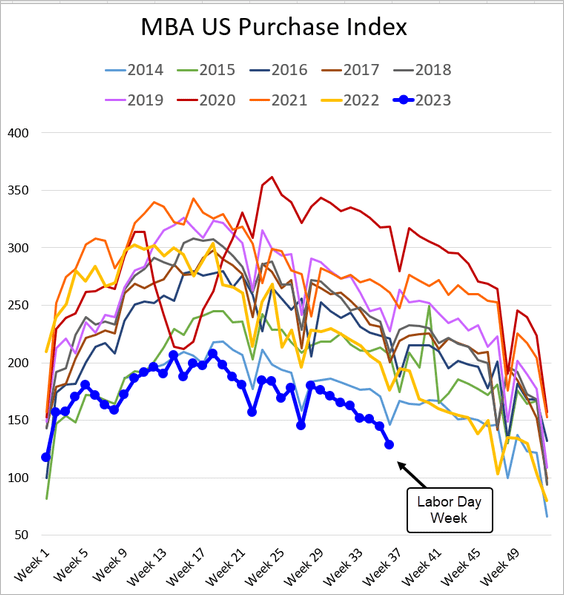
Housing Update
We talk a lot about housing each week, and the industry itself is little changed. It is a trite phrase in economics to say that we are in an “unprecedented” situation, but in the case of this housing market, it truly is unique in the history of the U.S.
This past week, we can see the mortgage applications (new purchase and refinance) are at the lowest point since the end of the Great Recession:
And as a result, “rate locks” (applications that actually look to be moving toward a closing date) are also at multiyear lows:
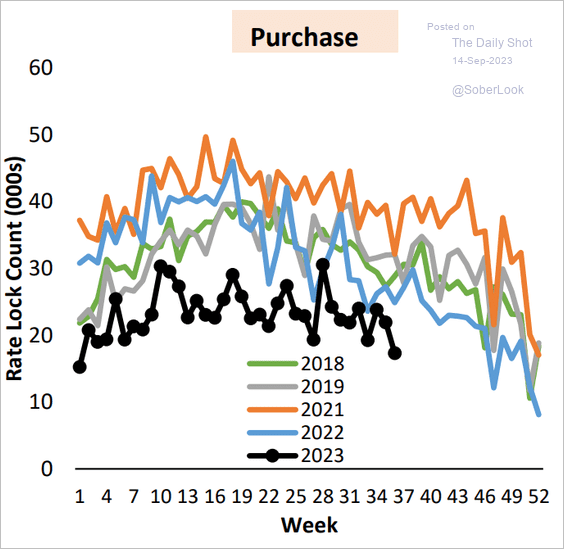
This is due to two factors happening concurrently: home prices have never been higher, and interest rates for a home loan have gone up 250% in the last two years. For the housing market to return to anything that even remotely looks like normal, one of these two factors must come down significantly (or both must come down moderately).

What this means for you
Home prices remain stubbornly high – for now. But something must break, and it will be house prices before it is interest rates. Housing is being heralded by many market analysts (and the real estate industry writ large) as a sign of resiliency, and we hear a lot of realtors and mortgage brokers trying very hard to convince homebuyers to make a purchase now. Don’t fall for it – you’ll have a much more competitive housing market on the other side of the coming recession.
We strongly believe we are headed for a significant housing market decline in the coming months that will begin in commercial real estate and then spread into residential as more and more “AirBnB” homes go back on the market, followed (sadly) by homes lost due to families’ inability to sustain the mortgage payment as the recession worsens.
Clients who are interested in buying a home or a second home may very well have the opportunity to do so at dramatically better prices in the next 18-24 months, but other clients who are interested in selling property may have a long time to wait for those home prices to return. Our macro models are not invested in either real estate or mortgage/property finance at this time.
Jobs Updates
We look at jobs regularly, and the current trajectory remains unchanged. Initial claims, while still low, are trending higher, and continuing claims remain my most persistent worry. This week’s initial jobless claims came in slightly below expectations, though trending against historical trends. This week, we have a couple of other significant bits of data that sheds better light on where we’re headed.
First, initial claims for unemployment were lower than expected but this was largely due to a huge number of claimants being rejected in – of all places – Ohio. More than 100,000 applications for unemployment were rejected nationwide due to reported cases of fraud, so the numbers this week are skewed downward slightly.
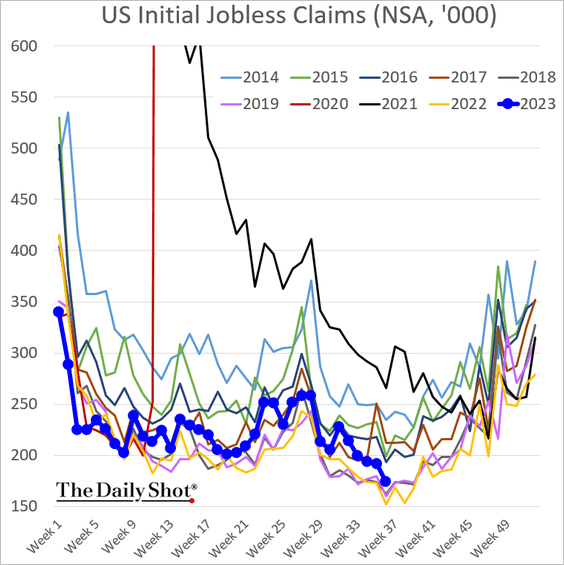
Even with that revision, we can see that compared to the last three normal employment years, our initial jobless claims remains elevated:

There is a strong indication that layoffs are about to ramp up, however, as this survey of CEOs indicates layoffs are becoming more of a priority for companies as they prepare for a harsher economic downturn:

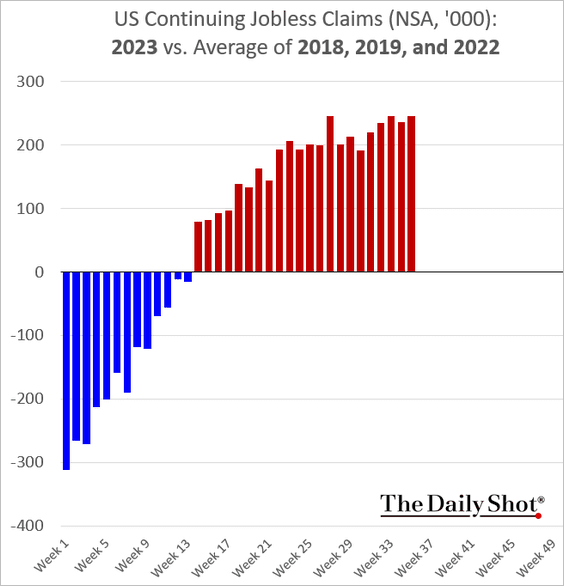
As I’ve mentioned many times in this space, initial claims are important (though they tend to be revised a LOT), but it is the continuing claims number that we must keep the closest watch on. Losing a job is one thing; not being able to find another one after weeks of looking is another thing entirely. Continuing claims continues to be the most important number to follow, and though it looks fairly stable in this graph…
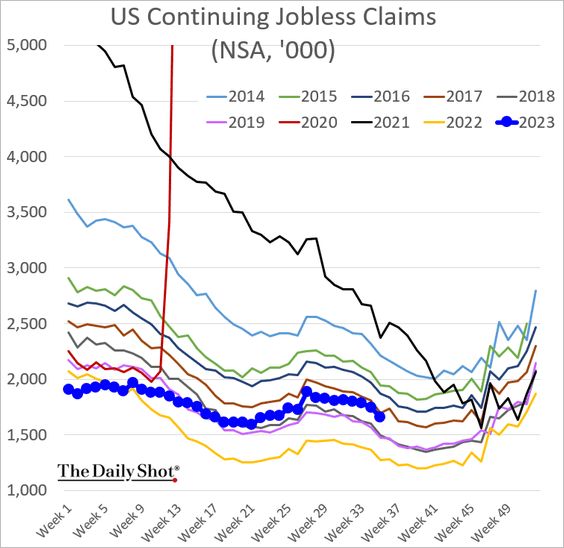
… the trend versus typical years is NOT good:
One interesting bit of data that I hadn’t seen in a long time that may be pertinent as we try to predict the coming jobs situation is the satisfaction employees report in their jobs, which has dropped significantly in the past couple of years. What is noteworthy about this graph is that employees are increasingly unhappy at their jobs, but the “Quit Rate” has plummeted in recent months. That means that though employees are largely dissatisfied with their work, no one is leaving for other opportunities anymore. It is an anecdotal but relevant data point that an unhappy employee is no longer finding anything better out there in the job market.

What this means to you
The job market is usually the last place to show a recession. There is usually a gradual slowdown, followed by a sudden, surprise, major uptick in layoffs all at once as the recession’s impact is finally felt. While employment remains relatively strong right now, it is showing much more obvious signs of strain. Sadly this will get worse as we head into a recession – that’s an economic certainty and one the Federal Reserve is actually trying to achieve without too many job losses. We urge our clients to reduce their debt load, increase their personal savings, and keep investments conservatively positioned for now.
A recession doesn’t mean the end of the world, but it does mean seeing our unemployment rate climb from its current 3.5% to maybe 5.5% or perhaps 6.5% in a very steep recession. That means, sadly, a lot of lost jobs and financial hardship for many families, so please take the risk of job insecurity seriously.
Small Business Update
Once monthly, we get significant survey results from small business owners, as published by the NFIB, a small business advocacy group (think AARP but for small companies). Small business surveys are important because contrary to conventional wisdom, small businesses provide roughly 75% of all of the jobs in the United States.
The August survey results showed Small Businesses are feeling the pinch of inflation again, and are concerned about their sales going forward. First, the overall optimism for small business remains significantly depressed and the August number turned down again after a little bit of improvement over the summer:

August sales were down significantly vs. expectations:

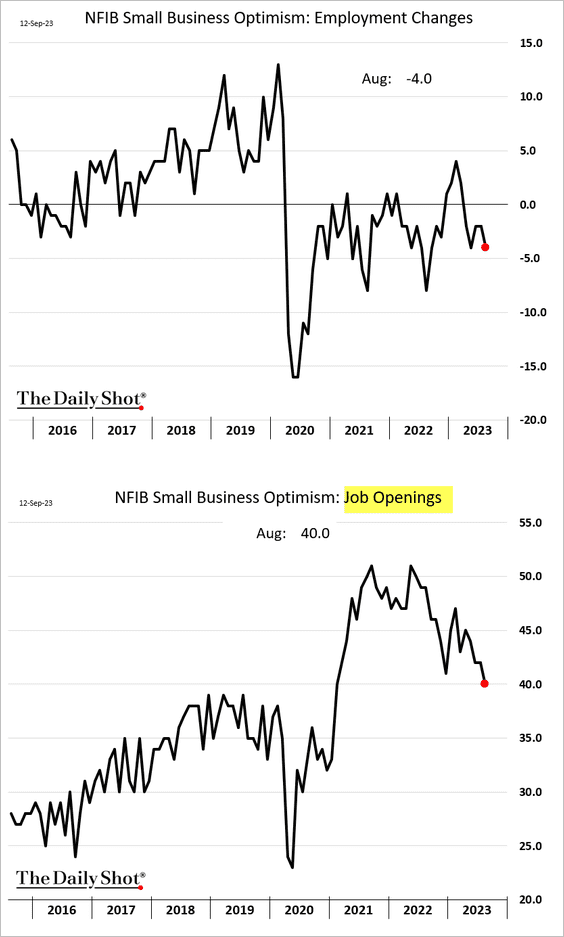
As a result, businesses cut jobs and do not intend to add more jobs in the coming months (2 graphs):
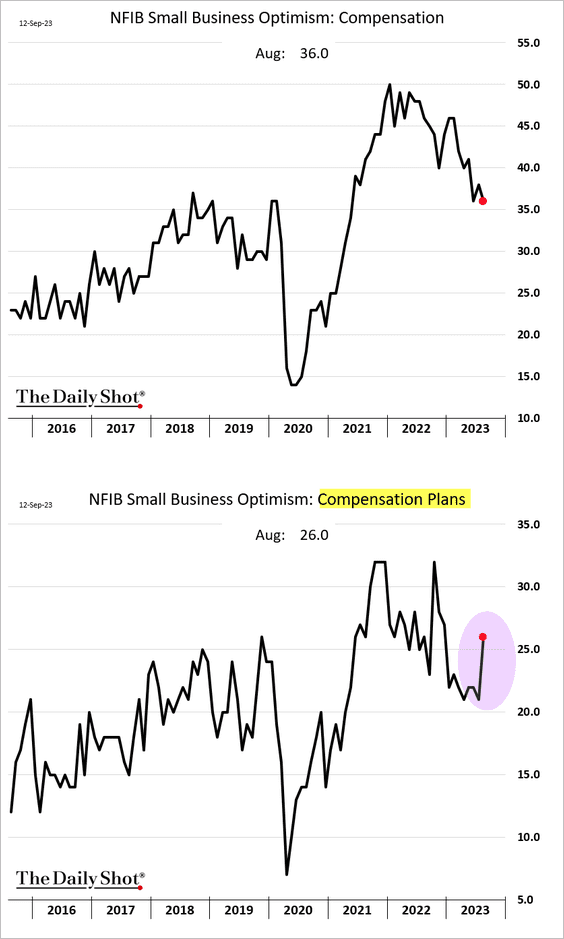
Overall compensation packages to employees were down, as well, but interestingly, the cost of compensation plans spiked significantly. This would indicate that the cost of benefits for employees jumped, as did a number of payroll-related taxes. Here in Colorado, for instance, taxes began for a state-run family leave policy that takes effect in January 2024.
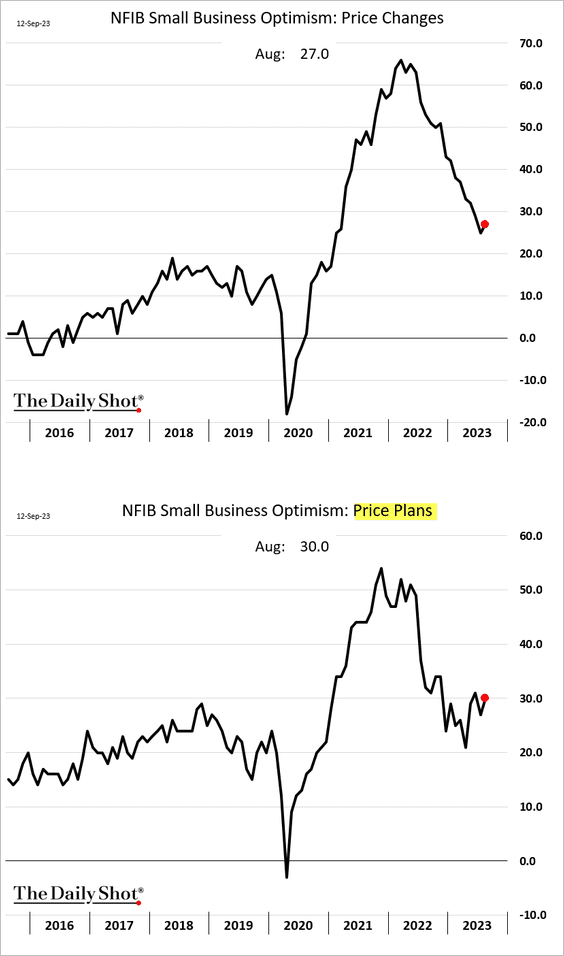
This had the effect of seeing small business start to increase their prices again (chart 1) with even bigger price increases coming on the months ahead (chart 2):
What this means for you
Despite the mega-corporations constantly making the headlines in our national media, small business accounts for nearly every job in America. The health of the small business will give us a clear indication as to the direction of the economy. We wish we could report better numbers for our clients and readers, but the indicators very clearly point to higher prices and a slower economy in the months ahead.
Manufacturing Update
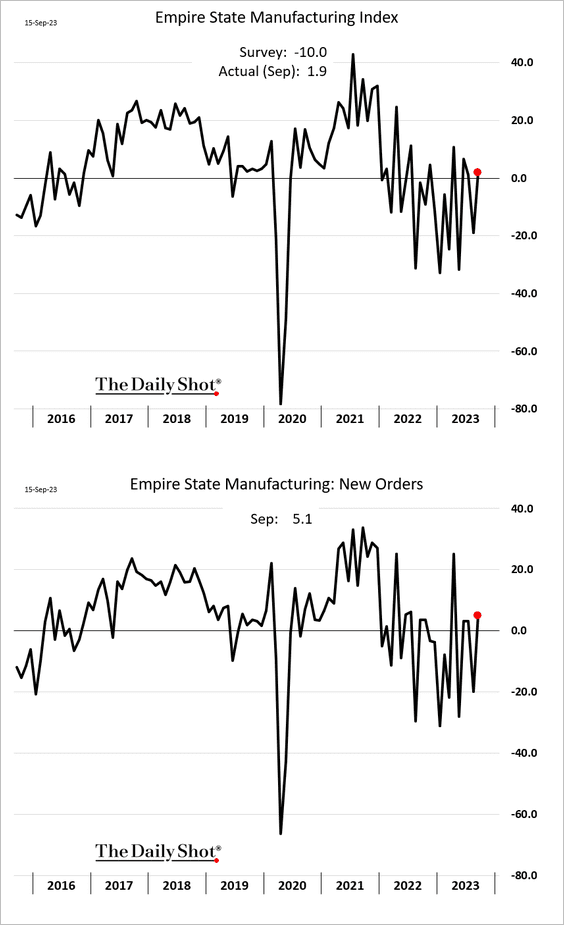
We got the Empire State (NY area) manufacturing numbers this past week, and I grow increasingly skeptical as to the importance of each number due to the growing wide swings month-to-month in this data (look at the data from before the Covid pandemic compared to the jagged “sawtooth” afterward). There is just too much discrepancy month-to-month in the Empire numbers to make them useful tools at this time. So we will take ALL of the nation’s data in total and present a more balanced picture of this information until the Empire numbers stabilize.
That said, manufacturing in the NY area appeared to spike up to just above recessionary area this past month (though look at how it slams pretty violently up and down since the end of 2020):
As we’ve seen already with CPI, PPI and the small business surveys, prices in the New York area are moving up, with even higher prices expected in the coming months. Inflation is NOT finished:

This chart is why I am VERY leery of the manufacturing strength reported this past month: hiring is down. That doesn’t match. So we will go with the hiring as a better sign of real manufacturing activity than what was reported in the headline survey (the first graph in this section). We believe manufacturing in the New York area is as it is everywhere else in the United States: declining.

What this means to you
This is just one month of data from one part of the U.S, but it confirms that inflation is showing up again pretty much everywhere, and with hiring slowing down, it appears companies are also preparing for a drop in revenue in the coming months as a recession gets underway.
Consumer Update
Finally, we have a collection of data to give us insight into how our families are holding up. The first thing to note is that there was a major difference in how consumers in different age ranges spent their disposable incomes this past summer.
Baby boomers and Gen Xers kept their spending on travel, recreation and dining out pretty modest, but Millennials and Gen Zers went wild in a kind of “YOLO” spending spree on activities. Does this mean that they are not feeling the pinch of what’s coming? Not likely. More likely, they haven’t experienced a recession personally yet (though there is much research to show that Millennials were deeply affected watching their own parents struggle through the Great Recession).
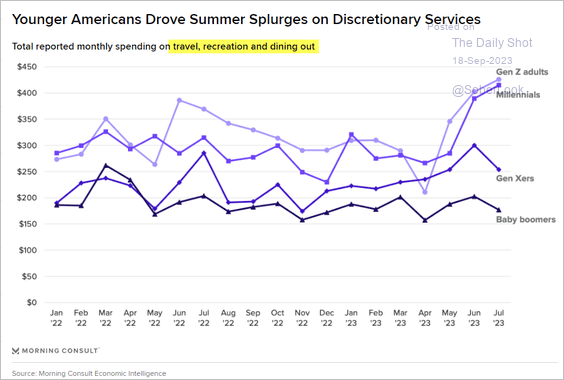
My personal theory is that the younger generation is most likely to have student loans that must be repaid, and as these come due in just two weeks, we will see this kind of spending drop significantly. It is possible that the Gen Z and Millennials who spent like crazy this summer were rationalizing those purchases because they knew with the return of their loan payments, they would not get nearly as many opportunities in the months ahead. I believe this was a “party before the bad stuff starts” kind of surge that will not repeat.
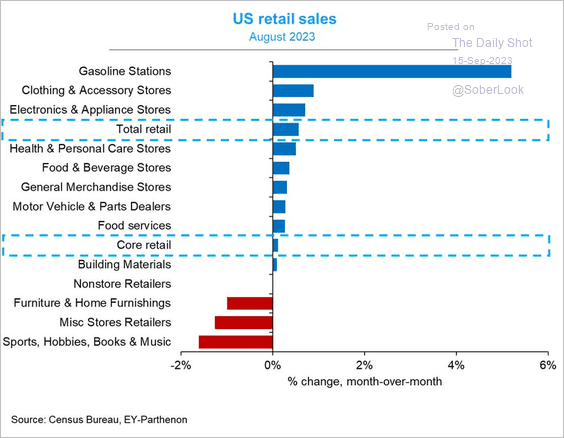
As a result of this spending spree by the younger generations, retail sales saw a bump up over the summer:
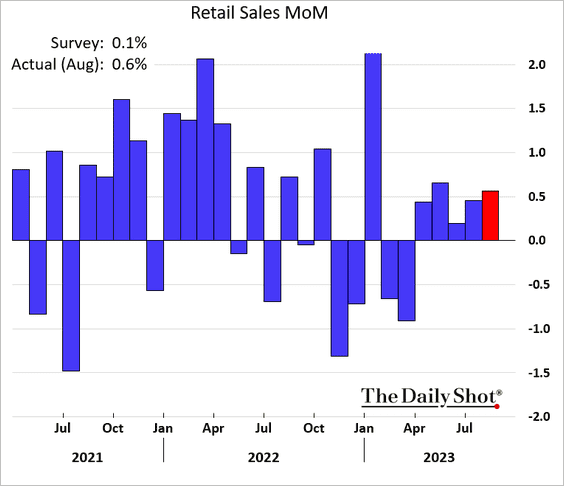
But let’s not get too excited about consumer discretionary stocks, since the vast majority of the increase in spending was just the high cost of filling our gas tanks:
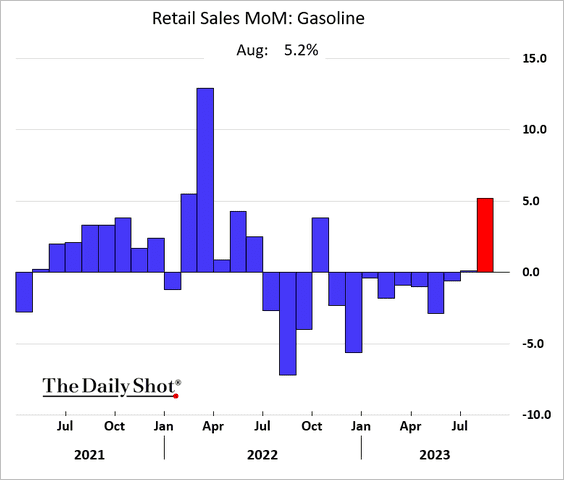
In fact, as we break up the retail sales figure into smaller pieces, we can see that gasoline stations – by a mile – saw the biggest increase in purchases.
What suffered? The things we can do without during a recession.
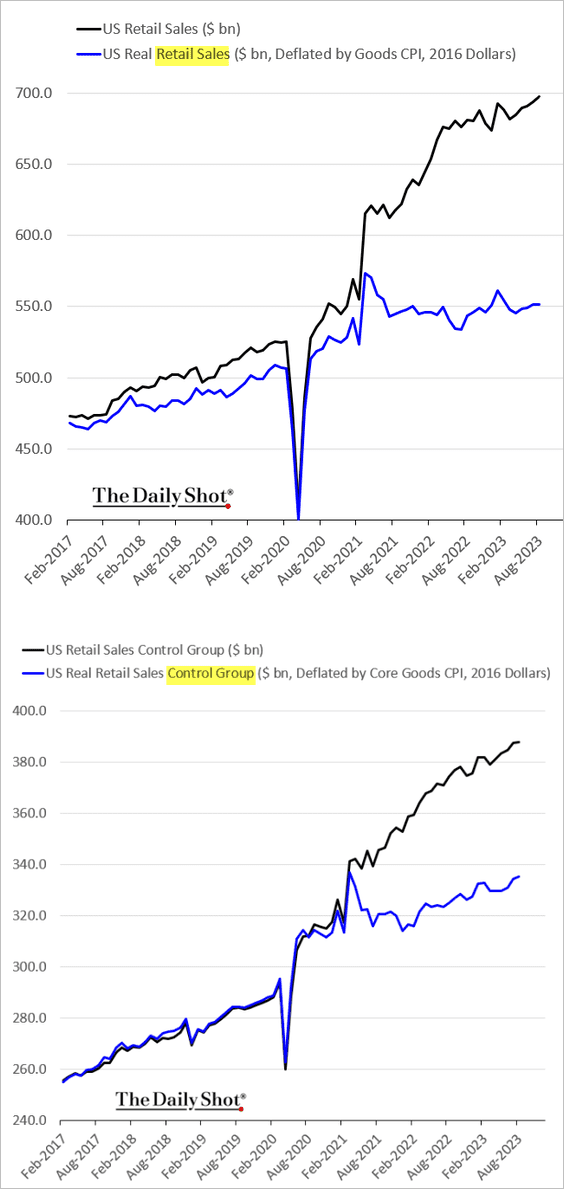
We cannot stress enough the effects of this long-term inflation on the budgets of American families. We are not consuming nearly as much as we were a few years ago, but we are paying substantially more for the items we do buy. We’ve shown this chart many times before but it bears mention every time we see it updated. The Black line is the retail sales as reported in today’s inflated costs, but the blue line is the actual goods and servings being bought with inflation removed.
What this means for you
Despite statements to the contrary from various market pundits, we see a significant slowdown in consumer spending well underway already, and that will only get worse as student loans return this month. The slow-down can be seen at every point in the supply chain, all the way back to U.S. manufacturers and overseas exporters. We firmly believe a recession is already here, but will not be officially acknowledged for at least 3 more months. We remain conservatively invested and allow the economy to direct our decisions, not market sentiment and herd bias. The data clearly shows, from nearly every angle we can find, a deteriorating economic environment, and our clients are correctly positioned for protection against, and even the possibility to gain from, the coming downturn.
Bottom Line:

Download our brand-new E-Book “7 Hacks To Recession-Proof Your Financial Life” today.
We remain convinced that a recession is imminent, even as the market fights back hard against it. Do not let the current market rally fool you – there is no sustainable way to grow profits (and therefore a supportable stock price) in an economy that is rapidly losing steam. Corporate profit reports are backward-looking and economic projections are forward-looking. Do not be lulled into complacency just because the stock market allows itself to.
We’ve been alerting our clients for nearly two years now that inflation was going to cause significant problems and our central banks would have to take progressively stronger actions to combat it. That appears to be a correct call.
No one knows exactly when a recession will be declared, but we firmly believe most of the larger economies of the world are right at the door of one now. Recessions can take years to recover from, which is why we believe it is vitally important to get your family and business finances ready to weather through such a storm.
We predicted the beginning of a turn in the current market rally last week, and we reiterate that sentiment now. There will always be market movement that runs counter to the economic data because markets are much more short-term focused, and let’s face it: until fear takes hold, greed is the prevailing emotional state of most market participants. We do believe, however, that the recent rally has fully run its course, and there will soon be a strong shift from stocks into safer investment options such as corporate and government bonds. With interest rates this high, getting a 5% or better yield, risk-free is becoming a more and more attractive option for investors concerned about the coming economic uncertainty. Once there is consensus that either the economy is earnestly deteriorating, or the Fed announces the end of rate hikes, the move from stocks to bonds will accelerate.
Whether you are our client or not, you need to consider the broader economy (and much less so the daily market fluctuations) when making investment decisions. The economy is telling us clearly what is coming, and you need to have your investment accounts prepared before that happens.
Just this past spring, I published an ebook to help you get your finances ready for the recession directly ahead. It’s yours totally free. Just click on the book image to access and download it.
Use these economic reports, and those of others working in this space, to prepare. You can not only avoid much of the pain that is coming, but you might actually profit from it, if your investments are properly positioned, and you’ve done what you can to shore up your business’ and family’s financial situation. If you need help with this, nVest Advisors has amazingly affordable personal financial planning and fiduciary investment management services to help you.
This is what we do for a living, and we’re very happy to partner with you on that endeavor.
Reach out to us for a totally free financial and portfolio checkup today if you’re concerned about where your finances sit for the coming few years, particularly if you are at or approaching retirement age. We’re delighted to offer you our thoughts. You can schedule that time with us below:
Watching This Week:
- Jobs Report
- Service Sector Update
- Commodities
[/fusion_text][/fusion_builder_column][/fusion_builder_row][/fusion_builder_container]

Jeremy Torgerson, CEO, CIO & Senior Advisor